Academic project: research a topic and create an infographic conveying the research found
Process
24″ x 36″
Adobe Indesign / Illustrator / Microsoft Excel / Procreate
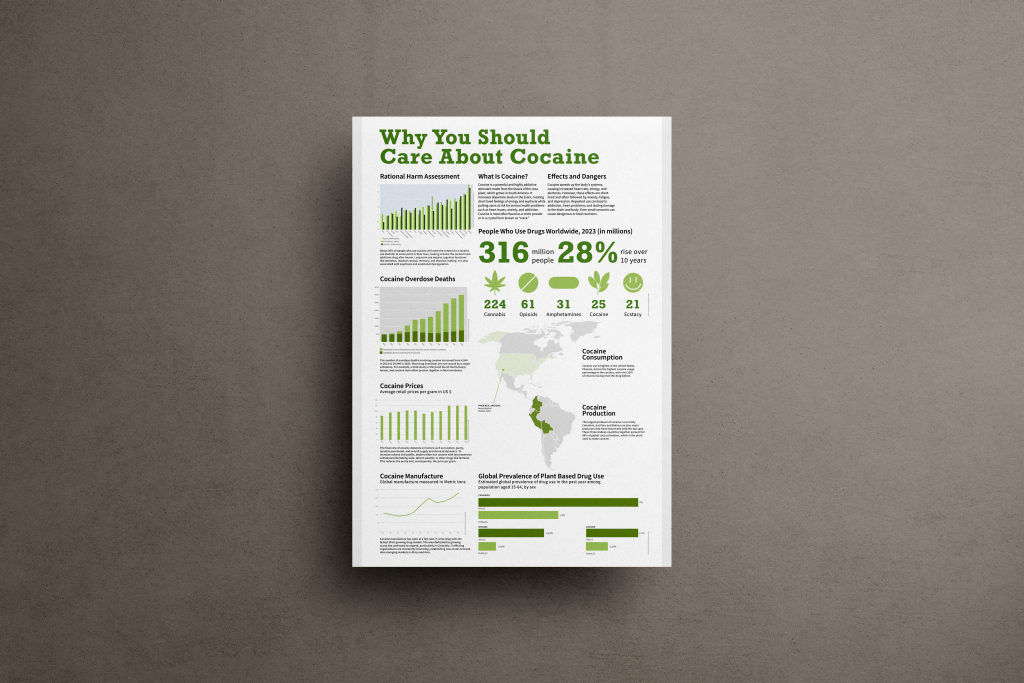
This project challenged me to create graphs and organize information in a way that is educational and purposeful to viewers. I began by researching cocaine to figure out what exactly I wanted to convey about the drug. after researching, i used Microsoft Excel to convert the data I found into visual graphs. In InDesign, I created a 6-column grid to work off of and added my graphs into the file. After lots of revising, printing, and tiling my infographic, I landed on what you see below.
My infographic is meant to inform viewers, who may not care about cocaine, why they should care about this drug. I included information that may surprise people; for example, cocaine is the drug with the fastest-growing illicit drug market in the world. Visually, I wanted to convey this information in a friendly and welcoming way in order to contrast with the dark topic. I chose the green color palette because cocaine is a plant-based drug, and the cocoa plant is, in fact, green.

Digital Adobe Indesign file